WinDbg is still one of the best tools for understanding Windows crashes, hangs, and user-mode process state. For many crash dumps, a correct symbol path and !analyze -v will get you oriented; deeper cases require comfort with threads, stacks, modules, memory, and exception context.
This post is about a different use case though: User Mode Debugging.
Step 1 is get the software. There are a range of options for downloading WinDBG, but its best to start here.
Then (optionally), get this great saved layout to configure your debugger which OA Labs have kindly put together. It is a .reg file, so just save it, then double click to apply to your local registry. It’ll make your WinDBG sessions look awesome right out of the gate.
The next thing is to make sure you have symbols configured.
When programs are linked the linker spits out .exe and .dll files. It also creates a number of additional files known as symbol files. Symbol files hold data which is not needed when running programs, but is great to have for debugging things. Symbols will map names for: Global variables, Local Variables, Function names and entry point addresses, Frame pointer omission (FPO) records and Source Line numbers - which might sound less useful, but imagine how helpful it would be when you send a bug report to the developer.
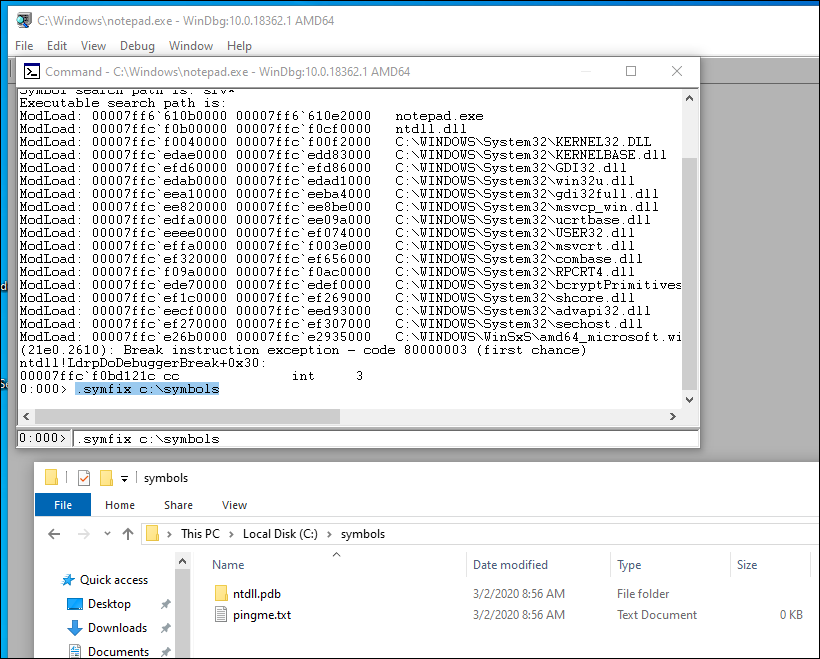
If you are just debugging Microsoft stuff and you want the quickest supported setup, you can actually jump right into the WinDBG UI and do: .symfix c:\symbols. That command will automatically point you at the Microsoft public symbols server and tell your debugging client to cache the symbol files in c:\symbols (note that every variable, function name etc in the file is a “symbol”, each symbol file contains thousands of “symbols”)
A better solution though, especially if you are going to be doing this a lot, is to set up an environment variable that will tell your debugger where to look for Microsoft symbols. It’ll do this every time, automatically if you set it up right. Best bet is to read the latest advice from Microsoft here but the short version is either do set _NT_SYMBOL_PATH=srv*c:\symbols*https://msdl.microsoft.com/download/symbols from the command prompt, or to open your environment variables in control panel and add an entry there.
What if the application wasn’t written by Microsoft?
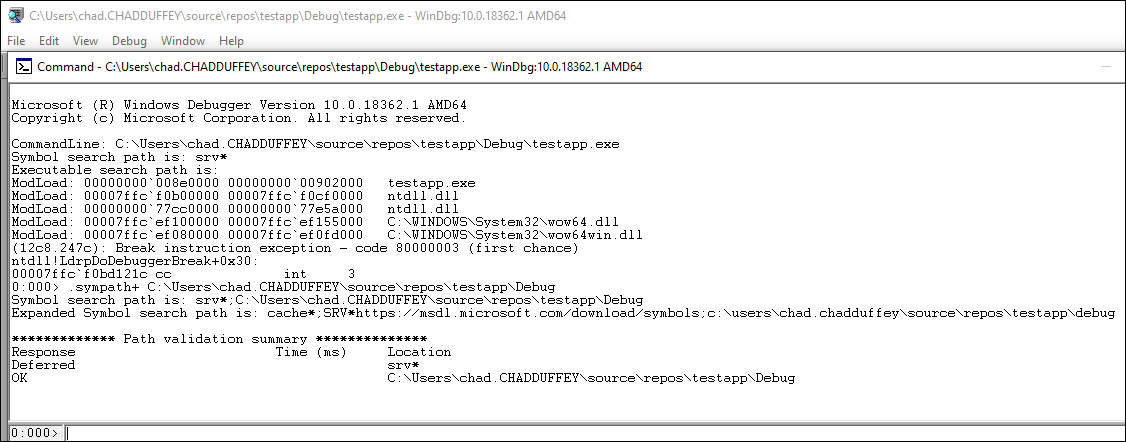
Well, its important that you still set up the Microsoft symbols since everything running on Windows will leverage some of the Windows libraries. But you also need to append the path to the additional software to the symbols path and you can do that like this: .sympath+ C:\FancyApplication\x64\Debug in the WinDBG console. You should then do a .reload.
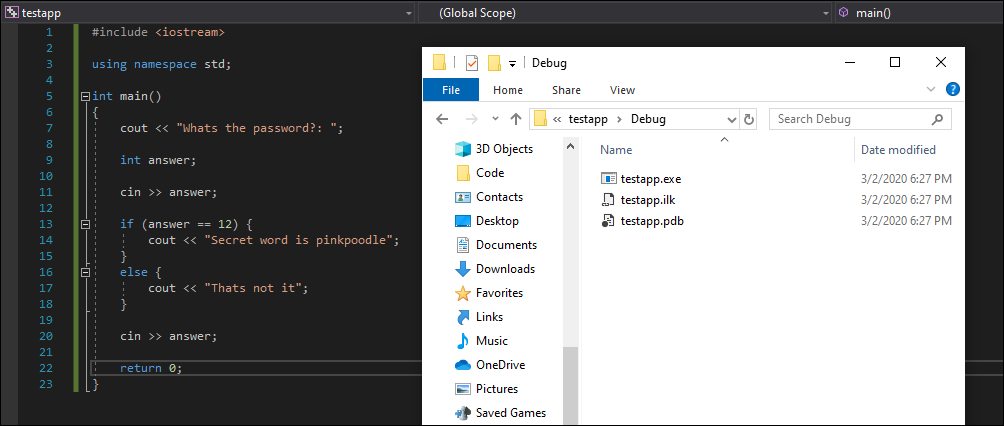
You can see that my test application has a symbol (.pdb) file in the debug directory of the visual studio project:
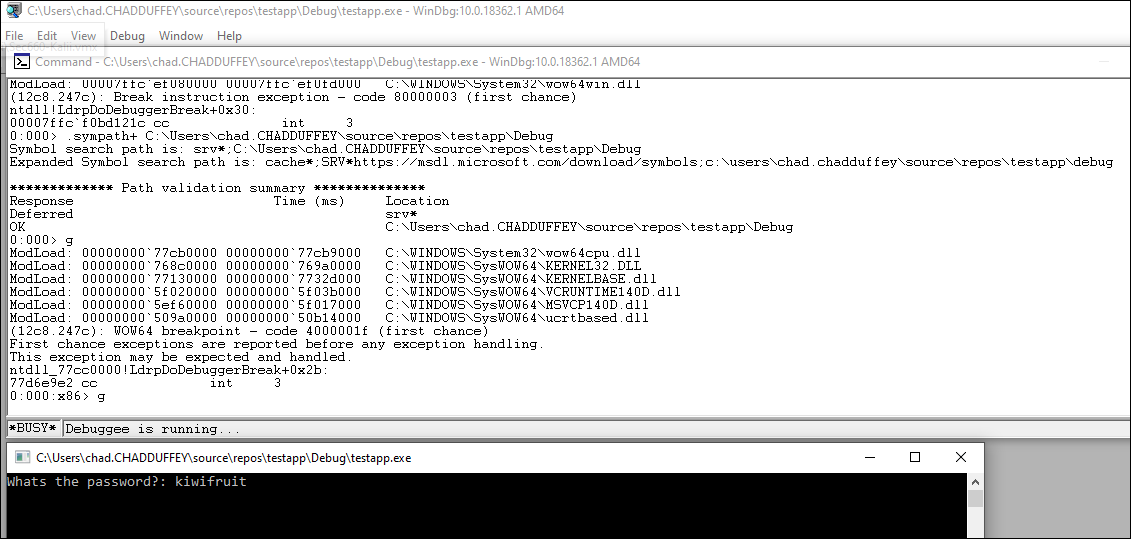
I add that to my debug session like this (see the last command I executed in the output, it is the .sympath+ command mentioned above):
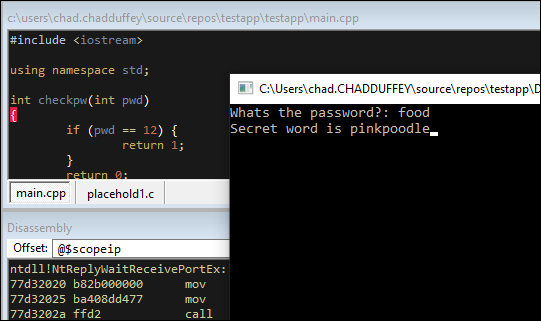
Actually, perfect timing to mention - this is the test app I will use to play in WinDBG some more:
#include <iostream>
using namespace std;

int checkpw(int pwd)
{
	if (pwd == 12) {
		return 1;
	}
	return 0;
}

int main()
{
	cout << "Whats the password?: ";

	int answer;
	cin >> answer;
	if (checkpw(answer)) {
		cout << "Secret word is pinkpoodle";
	}
	else {
		cout << "That is not it";
	}
	cin >> answer;
	return 0;
}
You can see that the sample has a few problems, but for the sake of looking at some basic WinDBG example it is fine.
Lets see if we can use WinDBG to bypass the password check, just as a very contrived example to show off some WinDBG commands.
First, I load the executable into the debugger by clicking through “file” > “open executable”. If I haven’t already, I add the custom symbol path as described just above. I’d also do a .reload to make sure the debugger knows about my extra symbols.
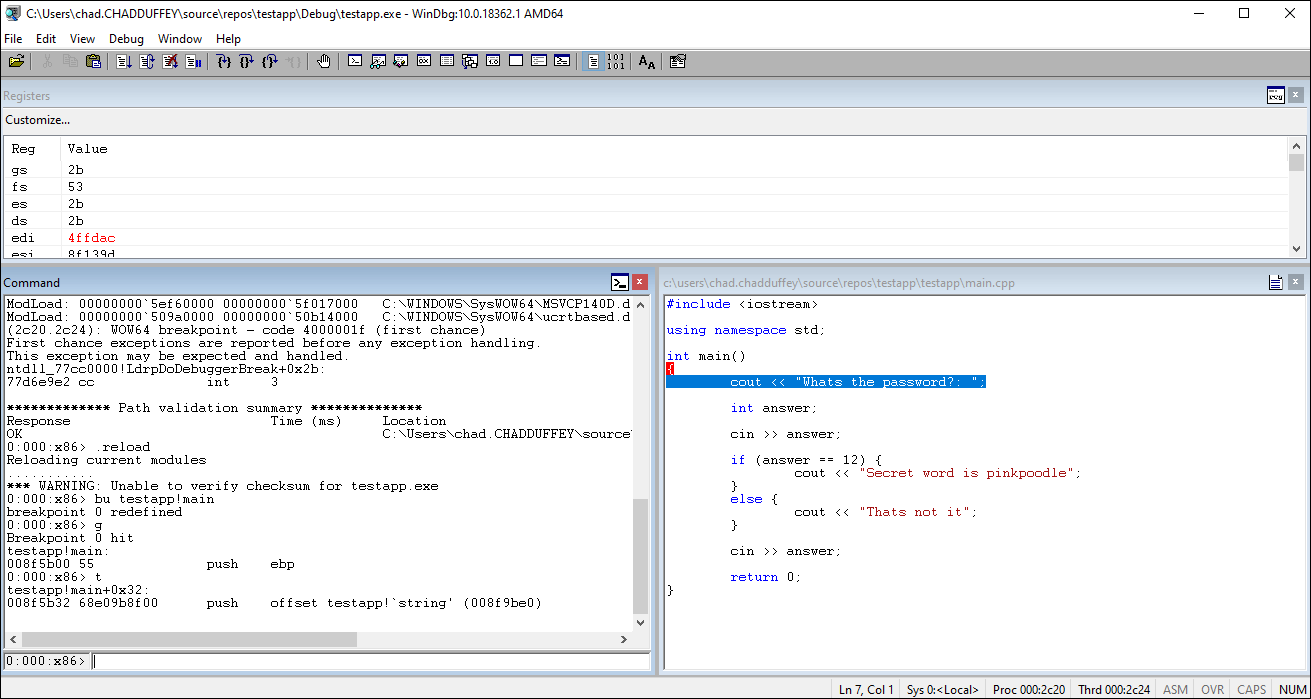
Then, I tell the debugger to stop when its ready to go with the main function:
bu testapp!main Breakpoint Commands. In this example I can see the source code and straight away the checkpw function looks interesting to me, so ill set one there as well bp testapp!checkpw
Then, I just type g for go to let the application run right up to the first breakpoint I just set.
Quick note: It isn’t always going to be the case that you’ll have source code access, but when you do you can configure it in windbg through the file menu and get a view similar to the one shown below. The cool thing is, that as we do the next bit “step into” (F11) we can see both the debugger view and the steps through the source code side by side.
A few other useful commands before going much further:
1) lm shows the loaded modules.
2) !address show all the memory addresses ranges mapped by the application.
3) Search s in memory for an ascii string like:
s -a 00040000 00044000 smb
if we were hunting for smb://server/something style connections.
4) Write memory: eb [address] [byte] to modify a byte of memory at the address. eb 500000 0xaa changes the byte at address 0x500000 to 0xaa.
Getting back to the point…
From the source code we can identify that if the testapp!checkpw function returns 1 the password check would pass. We could also see that another option would be to modify the flow of execution on the if statement that calls checkpw(). Decision’s, decisions.
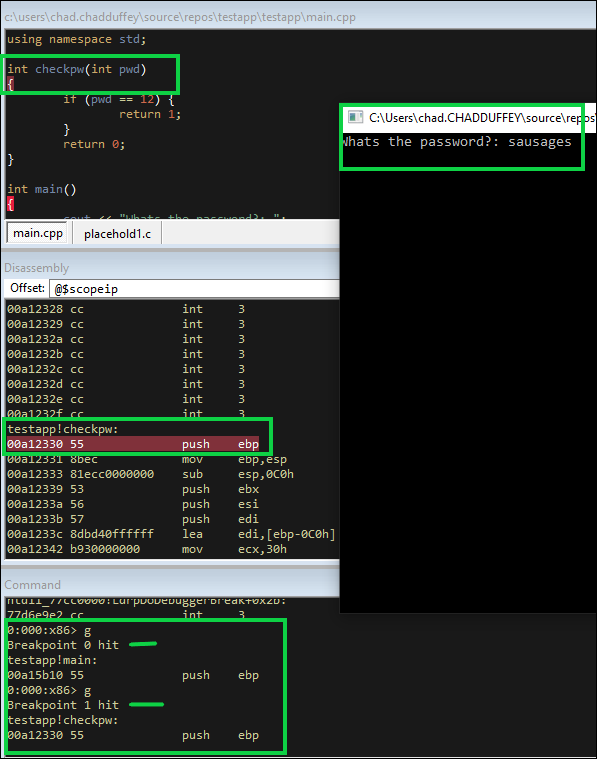
First thing though - we hit g to start the process running, and right away it hits our first breakpoint on the main function. Then, we hit g again, the application becomes response to us, we enter a test password and boom, breakpoint number 2, right as the application is entering the function to check the password. (The bottom highlighted box below shows the breakpoints being hit and the go commands)
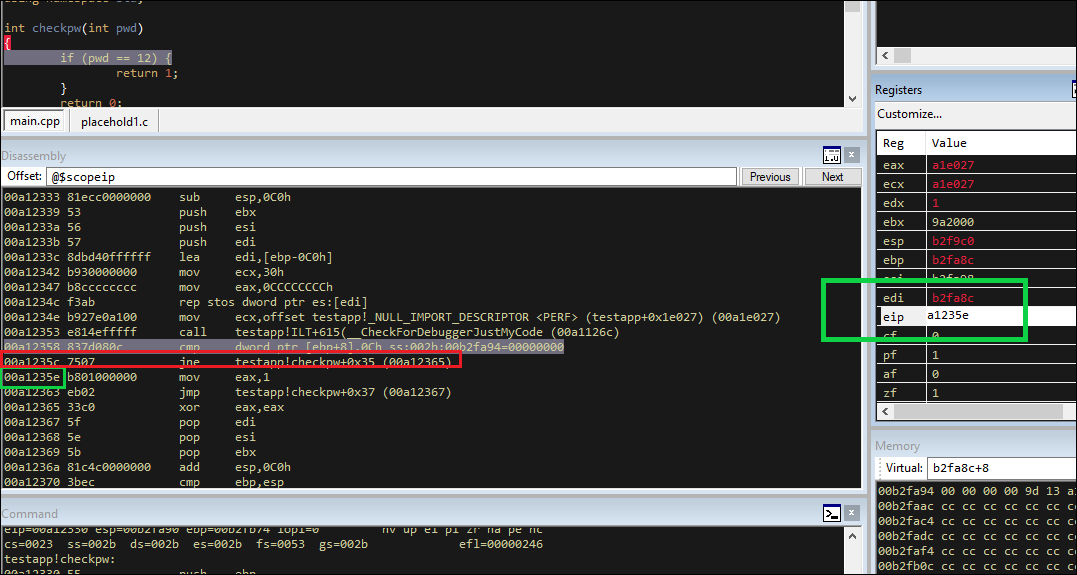
We press F11 to step into the next instruction and land right at the comparison code. The if (pwd == 12) section of checkpw. Only in assembly it looks like:
00a12358 837d080c cmp dword ptr [ebp+8],0Ch ss:002b:0113fcac=00000000
where 00a12358 is the memory address of this instruction.
837d080c is the instruction that starts at that memory address in bytes.
mp dword ptr [ebp+8],0Ch is the instruction displayed in assembly rather than bytes.
Notice we are cmp comparing the memory pointed to by the bytes at ebp+8 with 0C (12 decimal).
So one option, would be to modify the memory at the ebp +8 address to match 0C. We’d use eb [address] [byte] format.
Another, would be to modify comparison result register so that no matter what, the next line won’t jump. Because the next line is a JNE (jump if not equal) jne testapp!checkpw+0x35 (00a12365) and it checks the zf register to determine the result of the comparison instruction, if we mess with that flag before stepping again, we should be in business.
Maybe an even simpler approach though, is to simply modify the instruction pointer (shown in green) so that we completely skip the jump statement (shown in red) and land on the other side. Meaning, instead of jumping if not equal, where we know our password was wrong, just fall into the next line of code - the return 1 statement.
And, that works. We can see that even though we didn’t enter 12 as the password the only password the developer has written the application to accept, we bypassed the comparison instruction even with our bad guess of food and returned a success status to the calling function.
That’ll do for now, but I think I’ll add some more WinDBG notes real soon.
Honorable mention
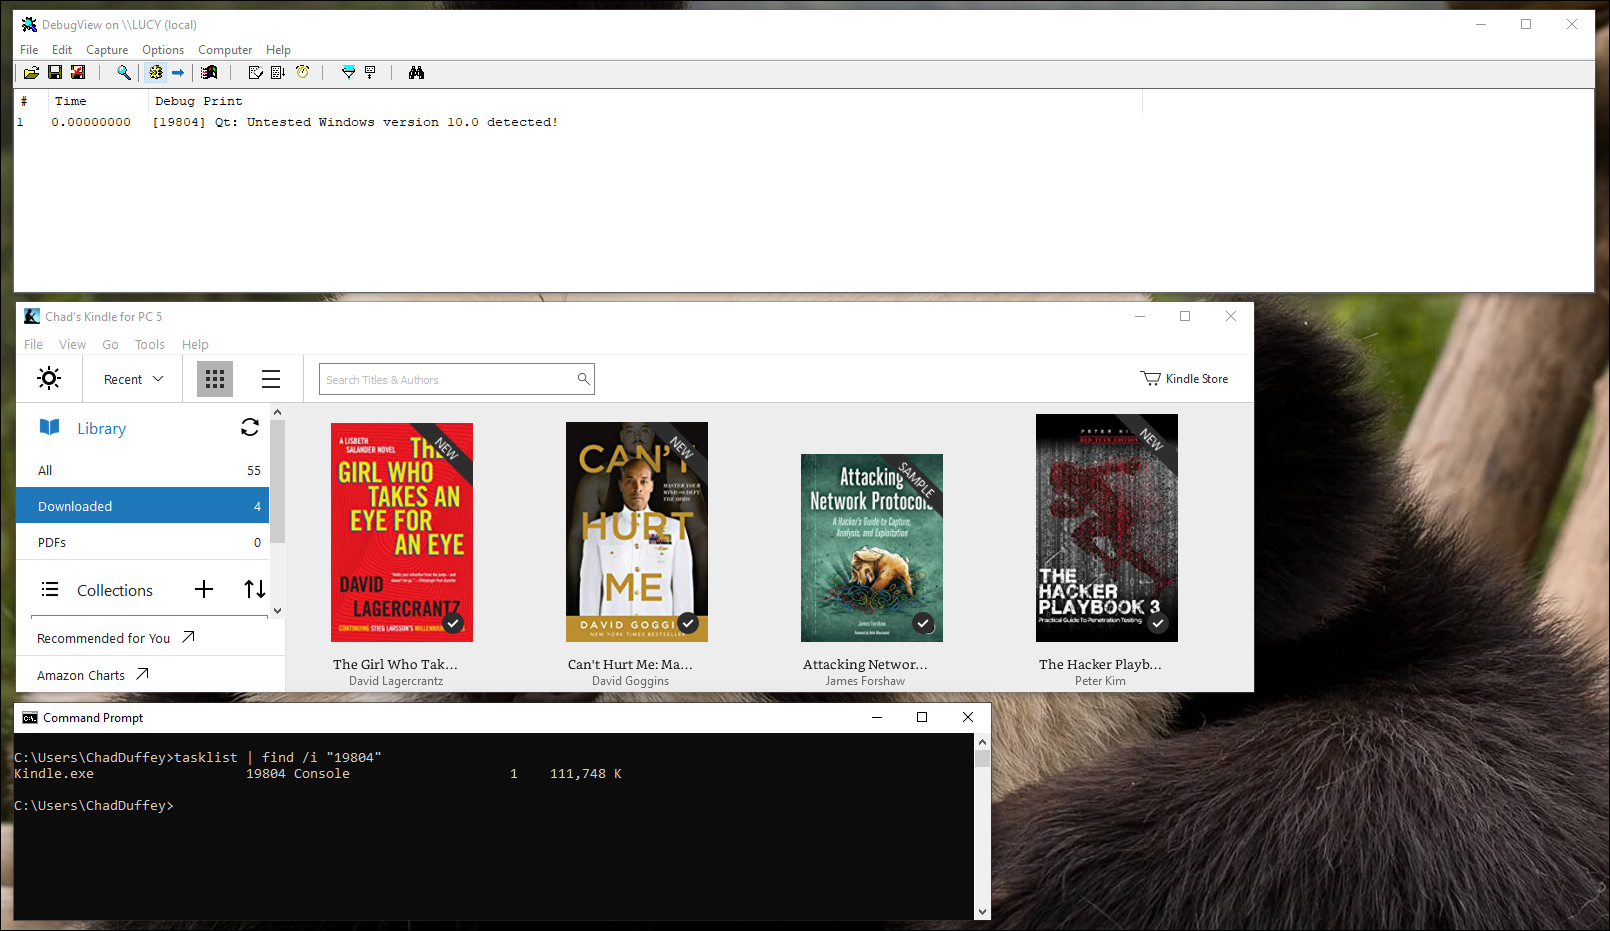
Actually, before I forget. The other thing you should consider running to understand application behavior is dbgview from sysinternals.
In the example below, I’m curious what the developers would be echo’ing in their debug sessions over at amazon.
Debug view reveals the things that would usually only be flagged in a debug session.
You can see that when I started my kindle reader it said Untested Windows version 10.0 detected!. Revealing a check function built into the kindle client. Maybe its to help the support team if you are using some crazy fast release beta version or something and they can’t make it work. Whatever the reason, it is not a message for the user, its a message for the support team and developers that they can probably toggle into a log file for troubleshooting.
(The command prompt in the visual is to show that we are able to confirm the debug string came from the kindle.exe process via the PID displayed in DebugView).