These are the GDB commands I reach for when working through small Linux reversing, CTF, and exploit-development labs. It is not a full GDB guide; it is a practical starter map for getting oriented inside a process, setting breakpoints, inspecting memory, and feeding controlled input into a binary.
Get oriented
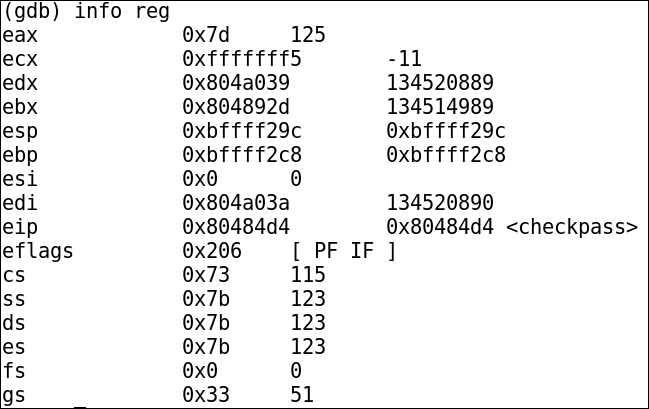
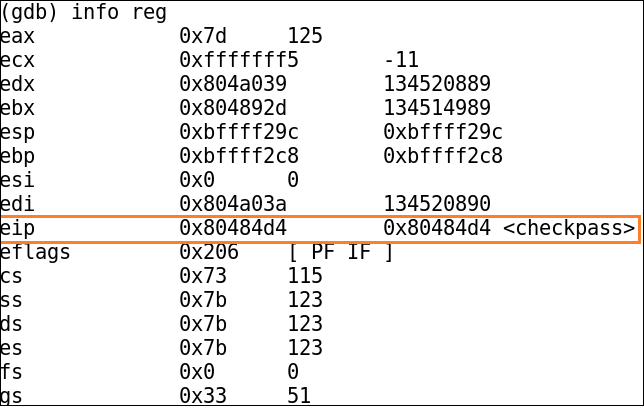
Display the current register state:
info reg
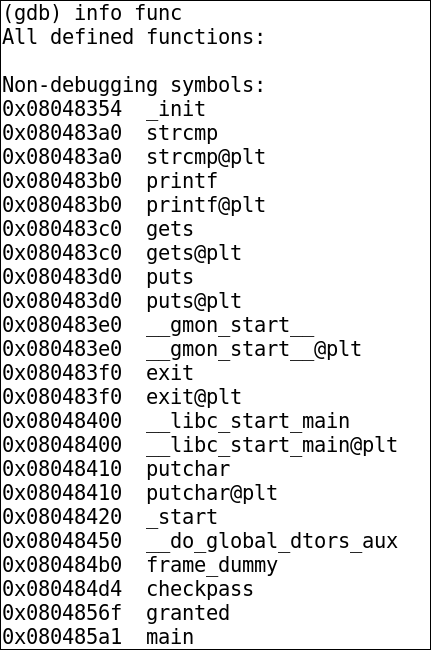
List functions that GDB knows about:
info func
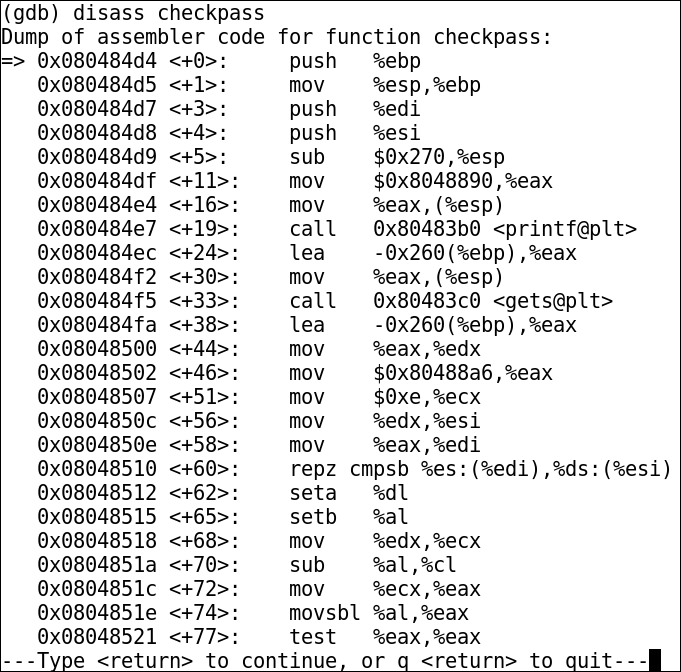
Disassemble a function:
disass functionname
If the output is easier for you to read in Intel syntax, switch the disassembly flavour:
set disassembly-flavor intel
To switch back to AT&T syntax:
set disassembly-flavor att
Break and resume execution
Set a breakpoint at an address:
break *0x080484d4
In this example, the checkpass function looks interesting, so execution is allowed to continue until the breakpoint is hit:
run
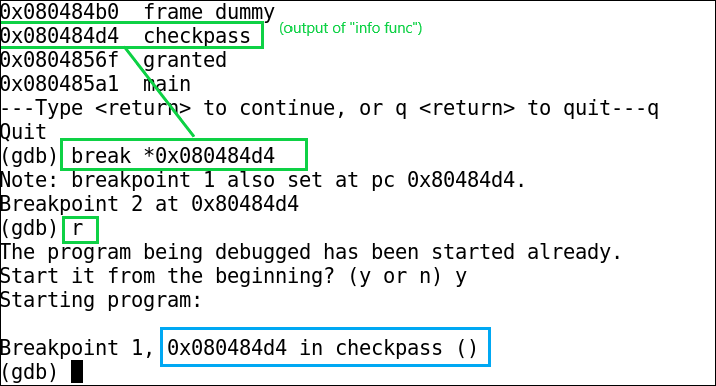
You can confirm the instruction pointer is sitting at the expected address:
List current breakpoints:
info break
Delete a breakpoint:
delete <breakpoint-number>
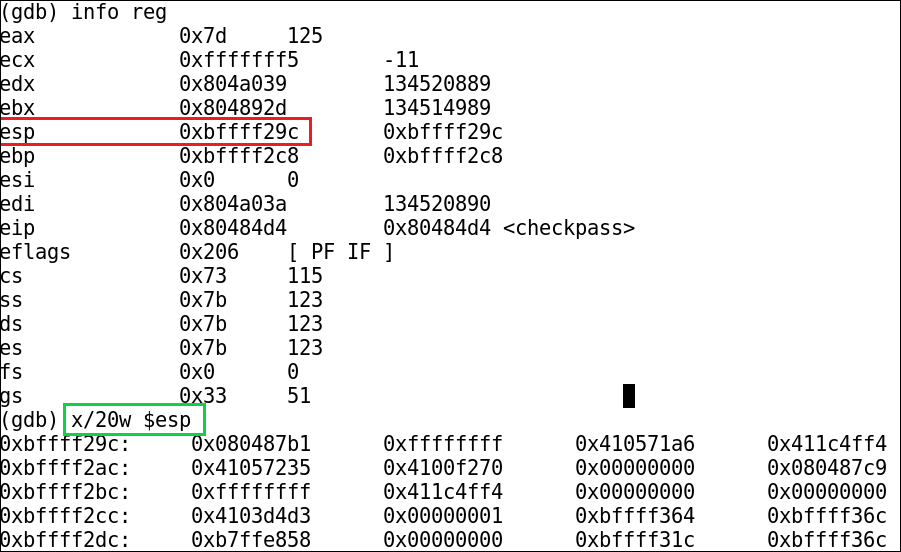
Inspect memory
Display 20 words starting at the stack pointer:
x/20w $esp
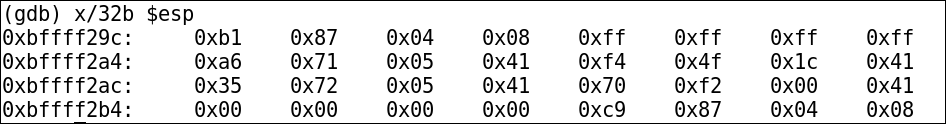
Display 32 bytes starting at the stack pointer:
x/32b $esp
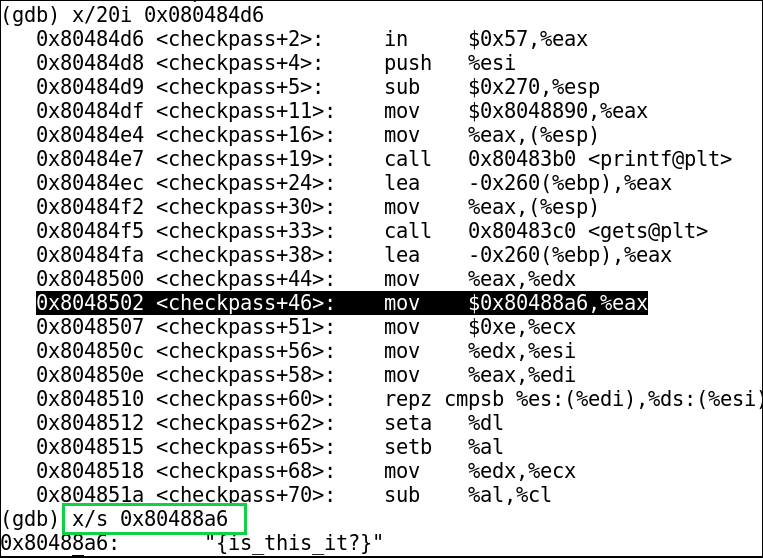
Display a string at a specific address:
x/s 0x80488a6
Display the instruction at a specific address:
x/i 0x80488a6
In this example, an interesting value is moved into EAX inside a function identified with info func. Because the challenge is password-related, that is a useful hint that the program may be loading a password or comparison value into a register:
Print useful values
Print a register:
print $esp
Print the address of a known symbol:
print system
Those simple checks are often enough to orient yourself before moving into more involved memory inspection or exploit development.
Run with controlled input
For simple labs, it is common to run a program with generated input from Python:
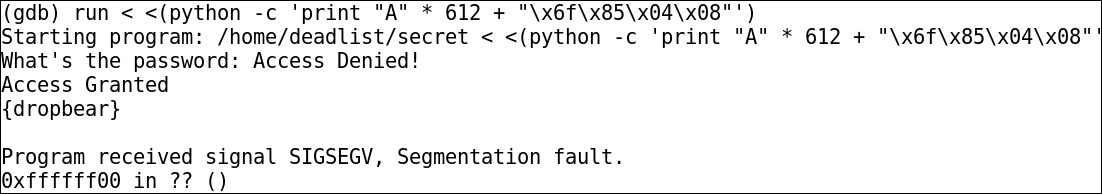
run < <(python -c 'print "A" * 612 + "\x6f\x85\x04\x08"')
There is a space between the two < characters. The shell uses process substitution to generate the input, and GDB passes it to the program on stdin.
In the original debug challenge, that input redirected execution to an access granted function and produced the flag.
The workflow
For small binaries, the basic loop is:
- List functions and disassemble anything interesting.
- Set a breakpoint at the decision point.
- Run the program with controlled input.
- Inspect registers and stack memory at the breakpoint.
- Adjust input based on what changed.
That loop is simple, but it is the foundation for a lot of debugging work: understand where execution is, understand what state the program has built, then change one thing at a time.