CreateProcess does far more than start a program: it builds enough process state, loader state, and subsystem state for execution to become possible.
The easy version of process creation is:
Program A calls
CreateProcess, then Program B starts running.
That is true in the same way that “I turned the key and the car moved” is true. Useful enough for daily life, but it skips the interesting machinery.
The more useful version is:
CreateProcessconstructs an execution environment. The image, process object, initial thread, subsystem state, address space, PEB, loader state, activation context, and imported DLL graph all have to be made believable before your code gets a turn.
That distinction matters for security work. A lot of detection engineering, malware triage, application control, EDR telemetry, and “why did this thing launch like that?” troubleshooting lives in the gap between those two sentences.
This post is a lab. We are going to launch a few familiar Windows executables and watch the operating system do work before the program’s own code is really underway.
A quick honesty note before we start: this is accurate to the best of my ability, but I am not writing it with current access to Windows source code or as someone presently on the Windows team. The confidence here comes from experiments, debugger output, public documentation like the CreateProcessW API reference, Windows Internals, and the behaviour we can observe ourselves. One of the more eye-opening things from my time around the Windows kernel team was seeing how often tiny details change: code paths move, edge cases appear, and things that are broadly true can have nuance under different conditions, such as low-memory systems, policy choices, architecture differences, or newer builds. So treat this as a well-tested practical model, not a claim that every internal branch looks exactly like this forever.
The short version
Windows Internals describes process creation as a staged flow. At a high level:
- The caller’s parameters and flags are converted and validated.
- The image to execute is found and opened.
- Windows creates the executive process object.
- Windows creates the initial thread, stack, and context.
- Windows performs subsystem-specific process initialization.
- The initial thread is resumed, unless the caller requested
CREATE_SUSPENDED. - Process initialization continues inside the new process, including user-mode loader work, DLL loading, TLS callbacks, and eventually the program entry point.
The public CreateProcessW documentation does not try to teach all of that internal machinery, but it does expose the shape of it: the function creates a new process and its primary thread, accepts creation flags such as CREATE_SUSPENDED, returns process and thread handles, and warns that a GUI process can still be busy with its own initialization after the API returns. Microsoft documents WaitForInputIdle as a way for a parent to wait until a GUI child process has finished enough of its initialization to be waiting for user input.
That last point is the tell: the API returned, but initialization was still happening.
Lab setup
Tools:
- Process Monitor
- WinDbg
gflags.exe, which on current setups may arrive with the Windows Driver Kit (WDK)- Visual Studio Build Tools, or any environment that can compile a tiny Win32 C++ program
If cl is not already available in your shell, install the Visual Studio C++ Build Tools:
winget install Microsoft.VisualStudio.2022.BuildTools --override "--wait --add Microsoft.VisualStudio.Workload.VCTools --includeRecommended"
After installing, open a new x64 compiler environment before building the sample:
cmd /k '"C:\Program Files (x86)\Microsoft Visual Studio\2022\BuildTools\Common7\Tools\VsDevCmd.bat" -arch=x64 -host_arch=x64'
The install path lives under Program Files (x86), but the -arch=x64 -host_arch=x64 arguments tell Visual Studio to use the 64-bit host compiler targeting 64-bit output.
For convenience, I have put the companion code in this repo:
If you are following along from the web, save the launcher code below as BeforeMainLauncher.cpp, open a Visual Studio Developer PowerShell in that folder, and build it with:
cl /EHsc /W4 .\BeforeMainLauncher.cpp
The program deliberately creates the child process suspended:
BOOL ok = CreateProcessW(
    nullptr,
    commandLine.data(),
    nullptr,
    nullptr,
    FALSE,
    CREATE_SUSPENDED,
    nullptr,
    nullptr,
    &si,
    &pi);
That gives us a clean pause after the kernel has created a process and thread, but before the child has been allowed to finish user-mode initialization.
Experiment 1: ProcMon sees the scaffolding
Start Process Monitor as Administrator.
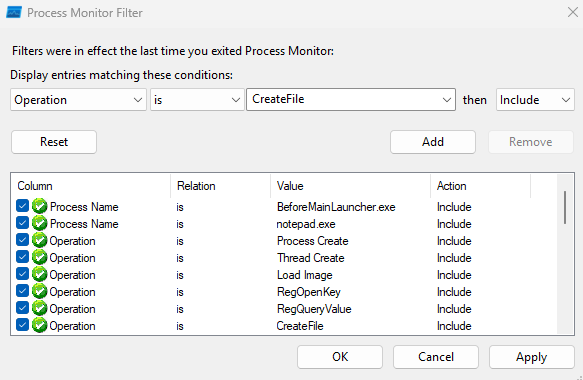
Use these filters:
Process Name is BeforeMainLauncher.exe Include
Process Name is notepad.exe Include
Operation is Process Create Include
Operation is Thread Create Include
Operation is Load Image Include
Operation is RegOpenKey Include
Operation is RegQueryValue Include
Operation is CreateFile Include
Then run:
.\BeforeMainLauncher.exe C:\Windows\System32\notepad.exe
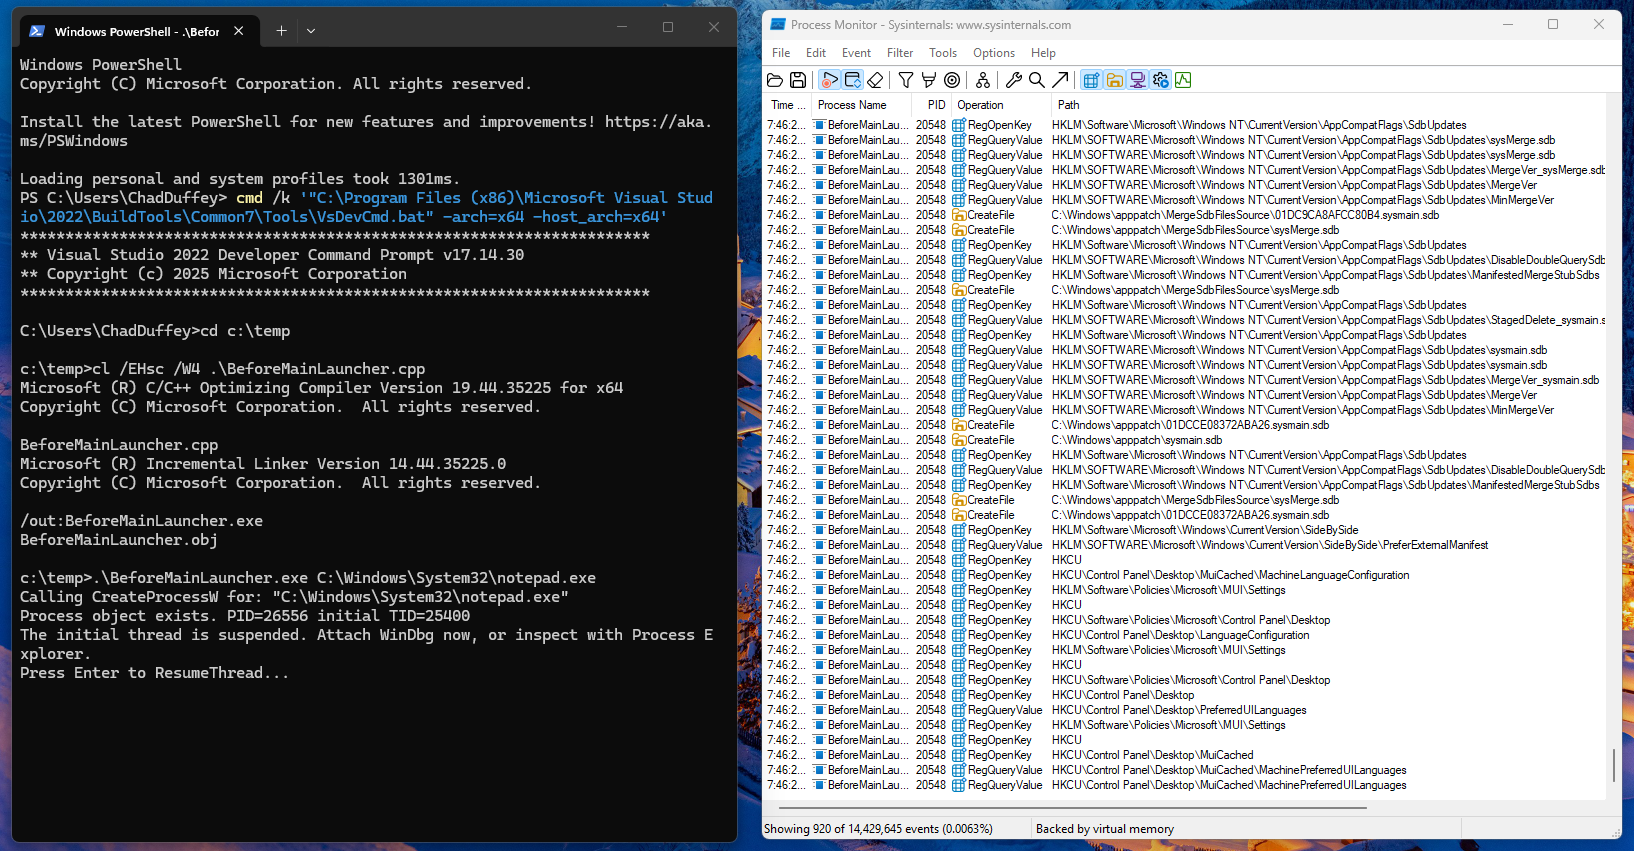
Do not press Enter in the launcher yet. The child has been created with its initial thread suspended.
One important ProcMon detail: before you resume the child, most of the interesting rows will still be attributed to BeforeMainLauncher.exe. That is expected. ProcMon’s Process Name column is the process performing the operation, and the process creation operation is performed by the launcher. Look at the Operation, Path, and Detail columns to see the child image, command line, PID, and thread ID.
There is another modern Windows wrinkle here: on a default Windows 11 install, Notepad may be the packaged Microsoft Store version. In that case you can pass C:\Windows\System32\notepad.exe to CreateProcessW, but ProcMon may show the process creation path as something like:
C:\Program Files\WindowsApps\Microsoft.WindowsNotepad_11.2512.26.0_x64__8wekyb3d8bbwe\Notepad\Notepad.exe
That is not a mistake in the trace. In my ProcMon capture, the process creation path queried the Image File Execution Options keys for notepad.exe, including AppExecutionAliasRedirect, then loaded ApiSetHost.AppExecutionAlias.dll, opened %LOCALAPPDATA%\Microsoft\WindowsApps\notepad.exe, queried AppX package state, and created the process from the WindowsApps package path. Microsoft documents packaged app execution aliases as a way for users and processes to start a packaged app without specifying the full path to the app.
So do not worry if your trace does not exactly match mine. On one system the Process Create path may be the classic image path:
C:\Windows\System32\notepad.exe
On another system, especially a current Windows 11 install, it may be the packaged Notepad path:
C:\Program Files\WindowsApps\Microsoft.WindowsNotepad_...\Notepad\Notepad.exe
In both cases, the command line in ProcMon may still show the original "C:\Windows\System32\notepad.exe". That difference between the requested command line and the final image path is the point.
Things to look for before resuming the child:
BeforeMainLauncher.exe -> Process Create -> C:\Windows\System32\notepad.exe
    or
BeforeMainLauncher.exe -> Process Create -> C:\Program Files\WindowsApps\Microsoft.WindowsNotepad_...\Notepad\Notepad.exe
BeforeMainLauncher.exe -> Thread Create  -> initial thread for the new notepad.exe process
BeforeMainLauncher.exe -> RegOpenKey     -> HKLM\SOFTWARE\Microsoft\Windows NT\CurrentVersion\Image File Execution Options\notepad.exe
BeforeMainLauncher.exe -> CreateFile     -> C:\Windows\System32\notepad.exe
BeforeMainLauncher.exe -> CreateFile     -> C:\Users\<you>\AppData\Local\Microsoft\WindowsApps\notepad.exe, if App Execution Alias resolution is in play
BeforeMainLauncher.exe -> Load Image     -> C:\Windows\System32\ntdll.dll
You can also use the PID printed by BeforeMainLauncher.exe to confirm the suspended child exists in Process Explorer before it has done much of anything in ProcMon.
Now press Enter in the launcher so it calls ResumeThread. More user-mode initialization can run, and the trace gets noisier. This is when you should expect to see rows attributed directly to notepad.exe. Depending on Windows version, configuration, and cache state, additional things worth looking for include:
notepad.exe    -> Load Image     -> C:\Windows\System32\KernelBase.dll
notepad.exe    -> Load Image     -> C:\Windows\System32\kernel32.dll
CreateFile     -> C:\Windows\System32\notepad.exe.Local
CreateFile     -> C:\Windows\System32\notepad.exe.manifest
CreateFile     -> C:\Windows\System32\en-US\notepad.exe.mui
CreateFile     -> C:\Windows\Prefetch\NOTEPAD.EXE-*.pf
Not every Windows build will show exactly the same rows. That is fine. What matters is that the trace disproves the toy model. The process creation path is not just “map EXE, jump to entry point.” You will see registry policy/debugger checks, executable file access, image mapping, and then loader-driven resource and dependency work before the application is meaningfully running.
The IFEO lookup is especially worth noticing. You do not have to configure IFEO for Windows to check whether it applies.
Experiment 2: IFEO proves CreateProcess is policy-aware
Image File Execution Options are a Windows mechanism commonly used for per-image debugging and diagnostics. Microsoft documents the IFEO Debugger setting as a way to configure a program so that it always runs in a debugger with specified options, and defenders also know that same Debugger value as a persistence and tampering location. See Running a Program in a Debugger and GFlags Details.
We can prove that process creation checks IFEO before normal execution.
Do not use Notepad for this test on current Windows. Packaged Notepad can have filtered IFEO entries such as UseFilter, FilterFullPath, and AppExecutionAliasRedirect, which can make the simple Debugger demonstration confusing. Use the demo executable instead, because it has a unique image name and no built-in App Execution Alias behaviour.
Open an elevated PowerShell from the folder containing BeforeMainLauncher.exe:
reg add "HKLM\SOFTWARE\Microsoft\Windows NT\CurrentVersion\Image File Execution Options\BeforeMainLauncher.exe" /v Debugger /t REG_SZ /d "C:\Windows\System32\cmd.exe /k echo IFEO caught BeforeMainLauncher.exe:" /f
Now run:
.\BeforeMainLauncher.exe C:\Windows\System32\notepad.exe
You should get cmd.exe, not the launcher. That proves the process creation path consulted IFEO before the target image ran.
Clean it up immediately:
reg delete "HKLM\SOFTWARE\Microsoft\Windows NT\CurrentVersion\Image File Execution Options\BeforeMainLauncher.exe" /v Debugger /f
Now run the launcher again and it should behave normally.
ProcMon will also make this visible. Filter on:
Path contains Image File Execution Options Include
Process Name is BeforeMainLauncher.exe Include
Process Name is cmd.exe Include
This is a useful blue team reminder. If a process launch turns into something surprising, do not start your investigation at the child entry point. Start with the execution environment that was constructed for it.
Experiment 3: catch the process before the loader finishes
Run the launcher again:
.\BeforeMainLauncher.exe C:\Windows\System32\notepad.exe
Leave it paused.
Attach WinDbg to the suspended Notepad process:
File -> Attach to a Process -> notepad.exe
Because this experiment attaches to an already-created suspended process, do not expect the same startup experience you get when WinDbg launches the target itself. In particular, Microsoft documents the debugger’s initial breakpoint for newly started targets, but attaching to an existing process is a different path.
Useful commands:
|
~
!peb
dt ntdll!_PEB @$peb
dt ntdll!_PEB @$peb Ldr
lm
To keep this section concrete without dumping pages of debugger output, it helps to focus on a few commands and a few lines from each.
Run:
!peb
Example output:
0:000> !peb
PEB at 000000bb`5f3a7000
    ImageBaseAddress: 00007ff7`6c1d0000
    ProcessParameters: 000000bb`5f3a8010
    Ldr: 00007ff8`c68f4520
What to notice: the process already has a PEB, process parameters, and a loader data structure before the program reaches its own interesting code.
Run:
dt ntdll!_PEB @$peb
dt ntdll!_PEB @$peb Ldr
Example output:
0:000> dt ntdll!_PEB @$peb
   +0x010 ImageBaseAddress : 0x00007ff7`6c1d0000 Void
   +0x020 ProcessParameters : 0x000000bb`5f3a8010 _RTL_USER_PROCESS_PARAMETERS
   +0x018 Ldr              : 0x00007ff8`c68f4520 _PEB_LDR_DATA
What to notice: symbols turn the PEB from a magic pointer into concrete process state you can reason about.
On current Windows, @$peb points at the Process Environment Block for the debuggee. The PEB contains process-wide user-mode state used by the loader and other runtime components. The Ldr member points at loader-maintained module lists. The exact structure offsets can move between architectures and builds, so prefer symbols and dt over memorised offsets where possible. If you want to keep digging, take the Ldr pointer printed by dt and pass it to:
dt ntdll!_PEB_LDR_DATA <Ldr address>
Run:
lm
What to notice: the exact module list at this point is build- and timing-dependent, so the point is not to memorize a specific set of DLLs. The useful observation is simpler: the process already exists as a real debug target with a PEB and some initial loader-visible state even though the primary thread has not yet been resumed.
Now type:
g
Then break in again and look at lm a second time.
What to notice: after the thread runs, the module set usually becomes richer. This is where user-mode loader activity becomes more obvious. Depending on the target and the Windows build, you may now see additional UI, COM, text input, or side-by-side related modules. If you want to watch that startup chatter from the beginning, launch the target under WinDbg instead of attaching after creation; that is the point of the next experiment.
Now press Enter in the launcher so it calls ResumeThread.
In WinDbg, break again and compare:
!peb
lm
The loaded module list will be more interesting after the loader has run. You should see core DLLs such as ntdll, kernel32, KernelBase, user interface libraries, and the Notepad image itself. The exact list depends on your Windows version and Notepad implementation.
The important point: there is a period where the process object exists and the primary thread exists, but user-mode loader initialization has not completed.
Experiment 4: loader snaps show the noisy truth
Loader snaps are loud, ugly, and extremely useful.
If gflags.exe is not on your PATH, install the Windows Driver Kit (WDK) and then run it from:
C:\Program Files (x86)\Windows Kits\10\Debuggers\x64\gflags.exe
For this experiment, use charmap.exe instead of Notepad. On current Windows installs, Notepad is often the packaged Store version, which makes the launch path less clean for this specific loader-snaps demonstration.
Enable them for Character Map:
"C:\Program Files (x86)\Windows Kits\10\Debuggers\x64\gflags.exe" /i charmap.exe +sls
Confirm the setting:
"C:\Program Files (x86)\Windows Kits\10\Debuggers\x64\gflags.exe" /i charmap.exe
Start Character Map under WinDbg:
windbg C:\Windows\System32\charmap.exe
Then run:
g
This is where the useful output starts. A charmap.exe run can look like this:
4af0:46ec - LdrpInitializeProcess - INFO: Beginning execution of charmap.exe (C:\WINDOWS\System32\charmap.exe)
4af0:46ec - LdrLoadDll - ENTER: DLL name: KERNEL32.DLL
4af0:46ec - LdrpFindKnownDll - ENTER: DLL name: KERNEL32.DLL
4af0:46ec - LdrpMinimalMapModule - ENTER: DLL name: C:\WINDOWS\System32\KERNEL32.DLL
ModLoad: 00007ff8`c5260000 00007ff8`c5329000   C:\WINDOWS\System32\KERNEL32.DLL
4af0:46ec - LdrpPreprocessDllName - INFO: DLL api-ms-win-core-processthreads-l1-1-0.dll was redirected to C:\WINDOWS\SYSTEM32\kernelbase.dll by API set
4af0:46ec - LdrpGetProcedureAddress - INFO: Locating procedure "BaseThreadInitThunk" by name
4af0:46ec - LdrpFindDllActivationContext - INFO: Probing for the manifest of DLL "C:\WINDOWS\SYSTEM32\apphelp.dll" failed with status 0xc000008a
4af0:3944 - LdrpComputeLazyDllPath - INFO: DLL search path computed: C:\Windows\System32;...
4af0:46ec - LdrpPreprocessDllName - INFO: DLL COMCTL32.dll was redirected to C:\WINDOWS\WinSxS\...\COMCTL32.dll by SxS
4af0:46ec - LdrpMergeNodes - INFO: Merging a cycle rooted at GDI32.dll.
4af0:46ec - LdrpMergeNodes - INFO: Adding cyclic module gdi32full.dll.
4af0:46ec - LdrpMergeNodes - INFO: Adding cyclic module USER32.dll.
(4af0.46ec): Break instruction exception - code 80000003 (first chance)
ntdll!LdrpDoDebuggerBreak+0x35:
That is real loader-snaps output. It is much more than a plain module list.
What to notice:
LdrpInitializeProcessis the loader announcing that process initialization is underway.LdrpFindKnownDllandLdrpMinimalMapModuleshow the loader deciding where a DLL should come from and then mapping it.LdrpPreprocessDllName ... by API setis the clean proof that API Set contract names are being resolved to host DLLs during startup.LdrpGetProcedureAddressshows import and export resolution work happening before the application is interesting.LdrpFindDllActivationContextand theCOMCTL32.dll ... by SxSline show manifest and side-by-side assembly handling in the middle of startup.LdrpComputeLazyDllPathis the loader computing a DLL search path, which is useful when a startup problem turns out to be a search-order problem.LdrpMergeNodesis the loader building and reconciling the dependency graph, including cycles.- That break in
ntdll!LdrpDoDebuggerBreakmatters because it lands in the loader path, not incharmap.exe’s own code.
This is what makes loader snaps useful. They do not just show that DLLs loaded. They show why they loaded, where they came from, how names were rewritten, and which loader subsystems were involved.
Turn loader snaps off when you are done:
"C:\Program Files (x86)\Windows Kits\10\Debuggers\x64\gflags.exe" /i charmap.exe -sls
You can also inspect the flag from inside WinDbg:
!gflag
Microsoft documents the sls global flag abbreviation as “Show loader snaps”. Use it surgically and clean up after yourself.
Experiment 5: prove API Set redirection
Modern Windows binaries often import API Set contract DLL names such as:
api-ms-win-core-processthreads-l1-1-0.dll
api-ms-win-core-file-l1-1-0.dll
api-ms-win-core-libraryloader-l1-2-0.dll
Those names are API set contract names, not ordinary module names. Microsoft documents API sets as a virtual alias for a physical DLL file: they look like DLL names in imports and loader operations, but they do not directly refer to a file on disk. The loader resolves them to host DLLs such as KernelBase.dll, kernel32.dll, or other implementation DLLs depending on the API set mapping on that Windows build.
If you have Visual Studio tools installed, inspect imports:
dumpbin /imports .\BeforeMainLauncher.exe | findstr /i "api-ms ext-ms kernel"
dumpbin /imports C:\Windows\System32\charmap.exe | findstr /i "api-ms ext-ms kernel"
Then compare with what is actually loaded:
lm m kernelbase
lm m kernel32
lm m ntdll
lm m api*
On many systems, lm m api* will show nothing even though the import table contains api-ms-... names. That is the point. The lesson is not that every process will show the same contract names. The lesson is that an import name is not always the file that gets mapped. The Windows loader participates in name resolution, and API Sets are one of the ways it keeps user-mode binaries stable while implementation details move around.
This matters when reading ProcMon traces. If you are hunting for “who loaded api-ms-win-core-whatever.dll”, you may be chasing the contract name instead of the host module that actually landed in memory.
What CreateProcess is really doing
Here is the mental model I use now:
Caller
  |
  | CreateProcessW
  v
KernelBase / process creation user-mode path
  |
  | parse command line, validate flags, prepare attributes, consult policy/debugger/appcompat state
  v
NT system service boundary
  |
  | open executable image, create image section, create process object, create initial thread
  v
Windows subsystem setup
  |
  | process parameters, handles, console/window station/desktop-ish state, PEB-visible user-mode state
  v
Initial thread starts or remains suspended
  |
  | ntdll loader initialization, activation context, imports, API Set resolution, TLS callbacks
  v
Program entry point
  |
  | C/C++ runtime
  v
main / WinMain
That diagram is intentionally not a function-by-function reverse engineering map. Windows changes. Internal routines move. Builds differ. The durable lesson is the sequence of responsibilities.
The caller asks Windows to create a process. Windows has to create a credible universe for that process before the program gets control.
Why defenders should care
There are several practical detection lessons here.
First: process creation telemetry is a starting point, not a full explanation.
Sysmon Event ID 1, Security Event ID 4688, EDR process graphs, and ProcMon Process Create events tell you something launched. They do not automatically tell you which compatibility, IFEO, loader, manifest, or DLL resolution decisions shaped that launch.
Second: parent/child relationships can be truthful and still incomplete.
If Notepad launched because IFEO sent execution through a proxy binary, the parent/child chain may be truthful but still miss the key fact: the launch was intercepted by registry policy before Notepad itself ran.
Third: loader behaviour is attack surface and evidence.
DLL search order, SxS activation contexts, API Set resolution, known DLLs, and loaded module databases are not trivia. They explain why DLL hijacking works in one case and fails in another, why a module name in imports does not match a mapped file, and why “before main” can still include attacker-controlled code such as malicious DLL initialization or TLS callbacks.
Fourth: suspended processes are real processes.
A process created with CREATE_SUSPENDED has a process object and initial thread. Depending on exactly where you look and when, some initialization has happened and some has not. That is why process hollowing, early-bird APC injection, and debugger-based launch tricks all care about timing.
A small checklist for future investigations
When a Windows process launch looks weird, check:
1. Command line and image path
2. Parent process and creator process, if your telemetry distinguishes them
3. IFEO keys for the image name
4. AppCompatFlags and shim database evidence
5. Manifest and SxS probing
6. KnownDLLs and DLL search path behaviour
7. Loaded modules after loader initialization
8. Prefetch, SRUM, UserAssist, event logs, and ShimCache as presence evidence rather than proof of execution on modern Windows
9. Whether the process was created suspended
10. Whether the first interesting code was the EXE entry point, a DLL entry point, or a TLS callback
That list has saved me more than once from confidently explaining the wrong thing.
Sources worth keeping open
- Microsoft Learn:
CreateProcessW - Microsoft Learn:
WaitForInputIdle - Microsoft Learn: Process Monitor
- Microsoft Learn: Running a Program in a Debugger
- Microsoft Learn: GFlags
- Microsoft Learn:
!gflag - Microsoft Learn: Initial Breakpoint
- Microsoft Learn: Windows API sets
- Microsoft Learn: Application manifests
- Microsoft Learn: Activation contexts
- Microsoft Incident Response: Leveraging Windows Internals for Forensic Investigation
- Microsoft Press: Windows Internals, Part 1, 7th Edition
Closing thought
CreateProcess sounds like it just starts a program, but a process is more than code executing.
It constructs a process, applies policy, creates the initial thread, and sets up the execution environment that exists before the program reaches its own entry point.
Once you see that in ProcMon and WinDbg, a lot of Windows security work starts to look less magical. The weird registry read, the manifest miss, the unexpected DLL, the process that exists but has not run yet, the import that resolves somewhere else: those are not side quests. They are the machinery.