windows · windbg
The service is stuck stopping. What is it actually waiting for?
You click Stop. The service says Stopping. You make a coffee, come back, and it’s still stopping. Task Manager says it isn’t doing much of anything. Excellent.
We can probably find its PID and kill it, but before we do that… what is it actually waiting for? Windows has a bit more to tell us than the Services console lets on.
We’ll deliberately break a small service so we can reproduce the failures and check our diagnosis against its code. The first failure we’ll simulate is a worker waiting for an event nobody signals; the second will be two threads deadlocking. We’ll capture each with ProcDump and follow its threads in WinDbg.
Get set up
You’ll need a Windows 11 x64 lab machine, ProcDump, and WinDbg. Extract ProcDump to C:\Tools\ProcDump for the commands below.
Download the service lab ZIP and extract it to C:\Lab\ServiceStopLab. It includes the C++ source, an x64 executable, its matching private symbols (.pdb), and scripts to install and remove it. The README covers rebuilding with MSVC and downloaded-script execution policy.
Open PowerShell as administrator:
Set-Location C:\Lab\ServiceStopLab
.\Install-Lab.ps1
The installer creates ServiceStopLab, a manually started service running as LocalService in its own process. For safety, it refuses to replace an existing service. Use a lab machine if you can.
Fun note: in Windows PowerShell, sc is an alias for Set-Content, which is a rather different sort of service management. We’ll use sc.exe.
First, a service that stops
Start the working mode and query it:
sc.exe start ServiceStopLab normal
sc.exe queryex ServiceStopLab
Once it reports RUNNING, send Stop, then query it again:
sc.exe stop ServiceStopLab
sc.exe queryex ServiceStopLab
It should reach STOPPED. You might briefly catch STOP_PENDING, depending on timing.
The service control manager (SCM) delivers the stop request to our control handler:
if (control == SERVICE_CONTROL_STOP) {
    ReportStatus(SERVICE_STOP_PENDING);
    Signal(gStopEvent);
    return NO_ERROR;
}
Our helpers wrap SetServiceStatus and SetEvent, checking their results. The handler reports that we’re stopping, wakes the worker, and returns. Microsoft’s control-handler guidance says handlers need to return promptly; lengthy work belongs on another thread.
Meanwhile, ServiceMain waits for the worker to exit, closes the objects it created, and reports the final state:
Wait(gWorker);
CloseObjects();
ReportStatus(SERVICE_STOPPED);
Wait calls WaitForSingleObject(object, INFINITE) and checks its result. Waiting on a thread handle means waiting for that thread to terminate. If the worker never finishes, ServiceMain never reports STOPPED.
What does Stopping actually mean?
A service reports its own state to SCM. STOP_PENDING tells us it reported that it is shutting down. It doesn’t tell us what’s happening in the service or whether cleanup is making progress.
Two fields in SERVICE_STATUS help report progress:
| Field | What it tells us |
|---|---|
dwCheckPoint |
A progress value the service increments as a pending operation advances. |
dwWaitHint |
The service’s estimate, in milliseconds, of how long the pending operation needs. |
The wait hint is an estimate, not a promise that Windows will kill the process at exactly that interval.
Our lab reports checkpoint 1 and a 5,000 ms wait hint when stopping. Incrementing the checkpoint from a timer while the worker is stuck would give us a cheerful stream of fake progress, a mistake Microsoft’s SetServiceStatus documentation calls out.
Experiment 1: nobody signals the event
Start the first broken mode. As before, wait for RUNNING before sending Stop:
sc.exe start ServiceStopLab missing-event
sc.exe queryex ServiceStopLab
sc.exe stop ServiceStopLab
sc.exe queryex ServiceStopLab
This run stayed in STOP_PENDING. Here’s the relevant output from our capture:
SERVICE_NAME: ServiceStopLab
        TYPE               : 10  WIN32_OWN_PROCESS
        STATE              : 3  STOP_PENDING
        WIN32_EXIT_CODE    : 0  (0x0)
        SERVICE_EXIT_CODE  : 0  (0x0)
        CHECKPOINT         : 0x1
        WAIT_HINT          : 0x1388
        PID                : 25556
0x1388 is 5,000 in decimal. We haven’t reported an error, so the exit codes don’t explain the hang. Sending Stop again won’t help: once a service reports STOP_PENDING, SCM doesn’t transmit further control requests to it.
Capture it before killing it
Get the service’s PID, then take two full dumps five seconds apart:
$labService = Get-CimInstance Win32_Service -Filter "Name='ServiceStopLab'"
$labService | Select-Object Name, State, ProcessId, PathName
$null = New-Item -ItemType Directory -Force C:\Lab\ServiceStopLab\dumps

& C:\Tools\ProcDump\procdump64.exe -accepteula -ma $labService.ProcessId C:\Lab\ServiceStopLab\dumps\event-1.dmp
Start-Sleep -Seconds 5
& C:\Tools\ProcDump\procdump64.exe -accepteula -ma $labService.ProcessId C:\Lab\ServiceStopLab\dumps\event-2.dmp
Use new filenames if you repeat the capture. -ma includes the memory and handle information we’ll need. Collection can briefly pause the process; real application dumps may contain credentials and request data, so be careful sharing them around.
Two dumps let us compare the shutdown stacks and the objects those threads are waiting on.
ProcDump’s -h watches for a hung window. Our service doesn’t have one, so we’re capturing directly by PID.
Follow the thread that cannot finish
Open event-1.dmp in WinDbg: File → Open dump file, or Open Crash Dump in the classic SDK debugger used in these screenshots.
In the debugger command window, run:
.symfix C:\Lab\Symbols
.sympath+ C:\Lab\ServiceStopLab\bin
.reload /f ServiceStopLab.exe
~* k
.symfix configures Microsoft’s public symbols; .sympath+ adds our private PDB directory. Public symbols name the Windows wait functions; our PDB names the lab functions and variables. Keep the EXE/PDB pair from the same build as the dump.
~* k prints every thread’s call stack, including Windows housekeeping threads. Waiting for work is normal, so the first NtWaitForSingleObject you find isn’t automatically the villain.
Look for our ServiceMain and WorkerThread frames. In this dump they are debugger threads 4 and 5. To show just those stacks:
~4s
k
~5s
k
Choose the indexes from your own ~* k output. The number before Id: is the debugger index; the values after it are hexadecimal process and OS thread IDs.
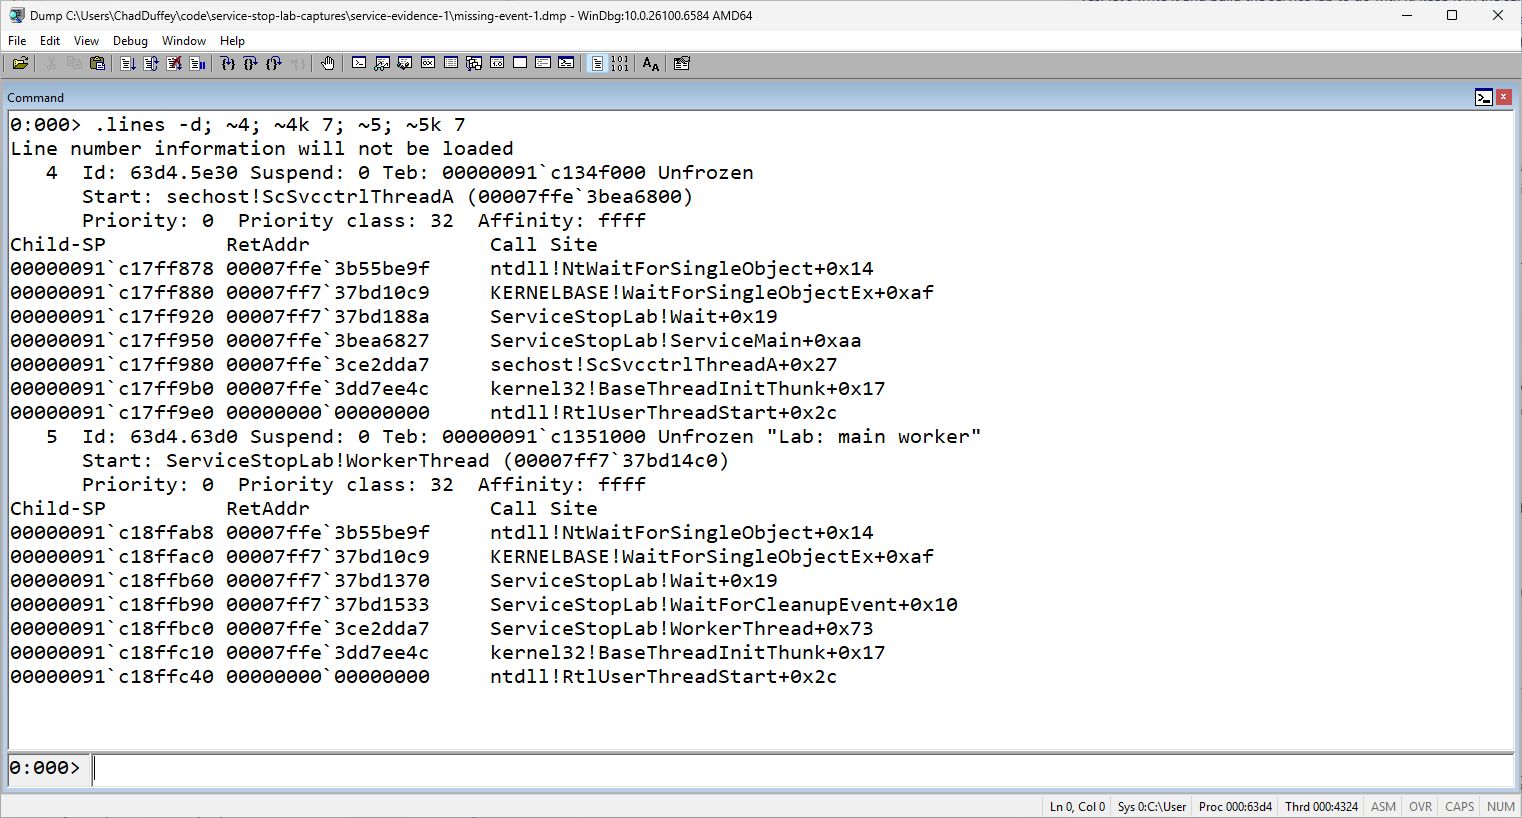
ServiceMain and its worker are both waiting. Click a screenshot to open it at full size.
The worker’s stack is more useful:
ntdll!NtWaitForSingleObject
KERNELBASE!WaitForSingleObjectEx
ServiceStopLab!Wait
ServiceStopLab!WaitForCleanupEvent
ServiceStopLab!WorkerThread
Read from the bottom upwards: the worker entered WaitForCleanupEvent and ended up in a Windows wait. Righto, what object is it waiting on?
Inspect the object, then find the missing action
The sample exposes its handles as globals so we can inspect them by name:
!handle poi(ServiceStopLab!gWorker) f
!handle poi(ServiceStopLab!gCleanupEvent) f
poi reads the handle stored in the global; f asks !handle for all available detail.
The worker handle identifies thread 63d4.63d0, matching our stack output. The cleanup event reports Event is Waiting:
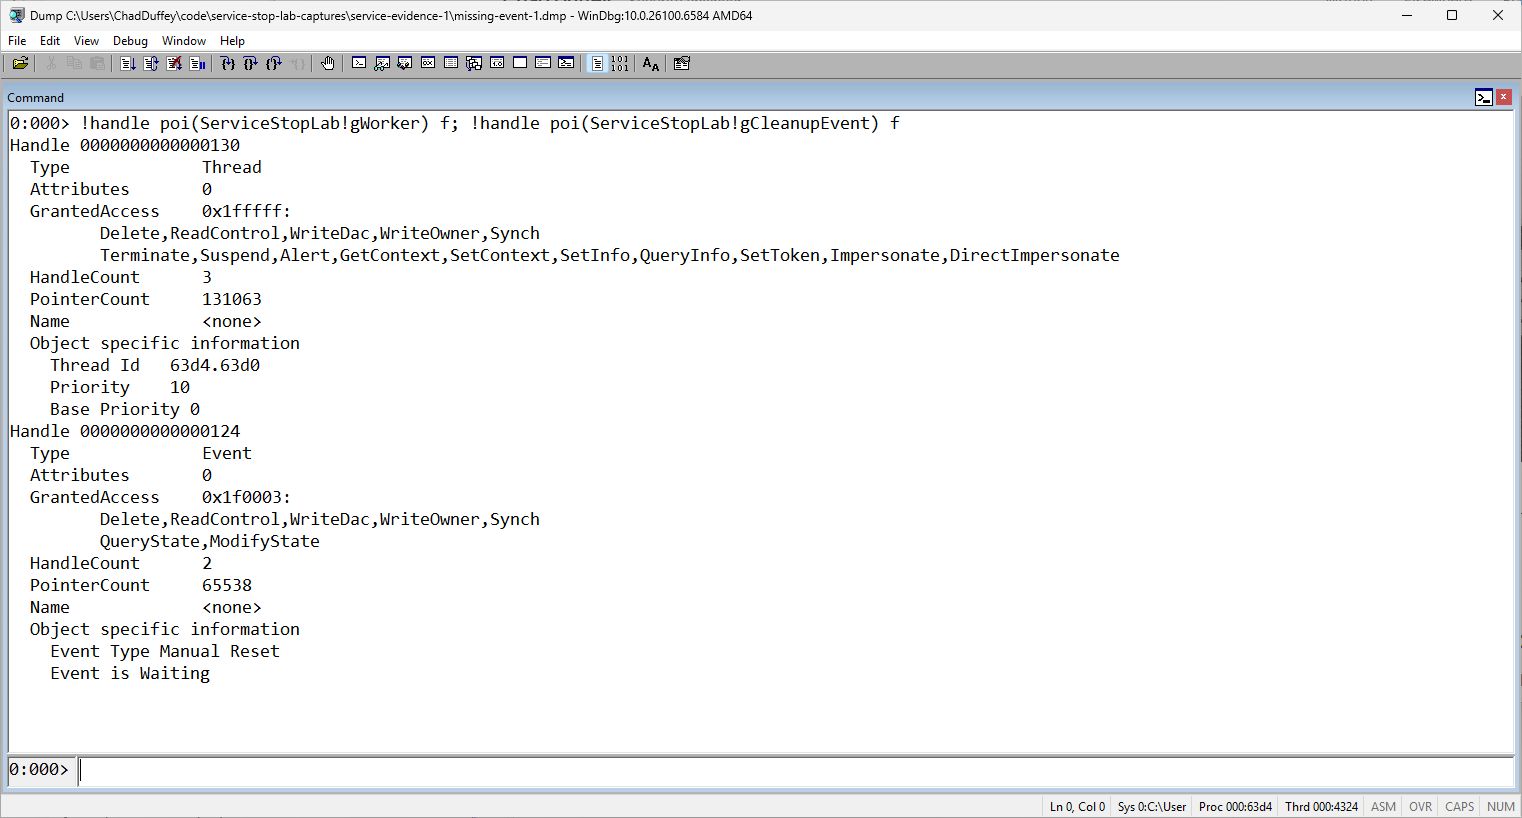
The cleanup event is a manual-reset event, unsignalled at capture time.
Events don’t have owning threads. We need to find the code that’s supposed to signal this one.
Here’s the relevant branch from the worker:
case Mode::Normal:
    Signal(gCleanupEvent);
    WaitForCleanupEvent();
    break;
case Mode::MissingEvent:
    WaitForCleanupEvent();
    break;
WaitForCleanupEvent calls Wait(gCleanupEvent). The event starts unsignalled, and nothing in MissingEvent mode signals it. Bugger. The worker is waiting for an action we’ve left out of the program.
That’s where the source earns its keep: the dump shows the current wait; the source explains why this mode can’t complete it. We won’t always have that source for a real service, so finding who should signal the event can take more digging.
Open event-2.dmp with the same symbols and compare. Our second dump showed the same cleanup wait and unsignalled event. Increasing a timeout would give this bug more time to do nothing.
For this sample, the fix is to supply the missing signal, as normal mode does with Signal(gCleanupEvent). The worker can then return and ServiceMain can report STOPPED, as it did in our baseline run. To check it again, reset the stuck lab and repeat the first stop test in normal mode.
Experiment 2: two threads waiting for each other
Reset-Lab.ps1 ends the stuck lab process and leaves the service installed. Reset it, then start the deadlock mode:
.\Reset-Lab.ps1
sc.exe start ServiceStopLab deadlock
sc.exe queryex ServiceStopLab
After it reaches RUNNING:
sc.exe stop ServiceStopLab
sc.exe queryex ServiceStopLab
$labService = Get-CimInstance Win32_Service -Filter "Name='ServiceStopLab'"
& C:\Tools\ProcDump\procdump64.exe -accepteula -ma $labService.ProcessId C:\Lab\ServiceStopLab\dumps\deadlock-1.dmp
Start-Sleep -Seconds 5
& C:\Tools\ProcDump\procdump64.exe -accepteula -ma $labService.ProcessId C:\Lab\ServiceStopLab\dumps\deadlock-2.dmp
Open deadlock-1.dmp with the same symbols and run ~* k. This run has two cleanup threads, debugger indexes 5 and 6:
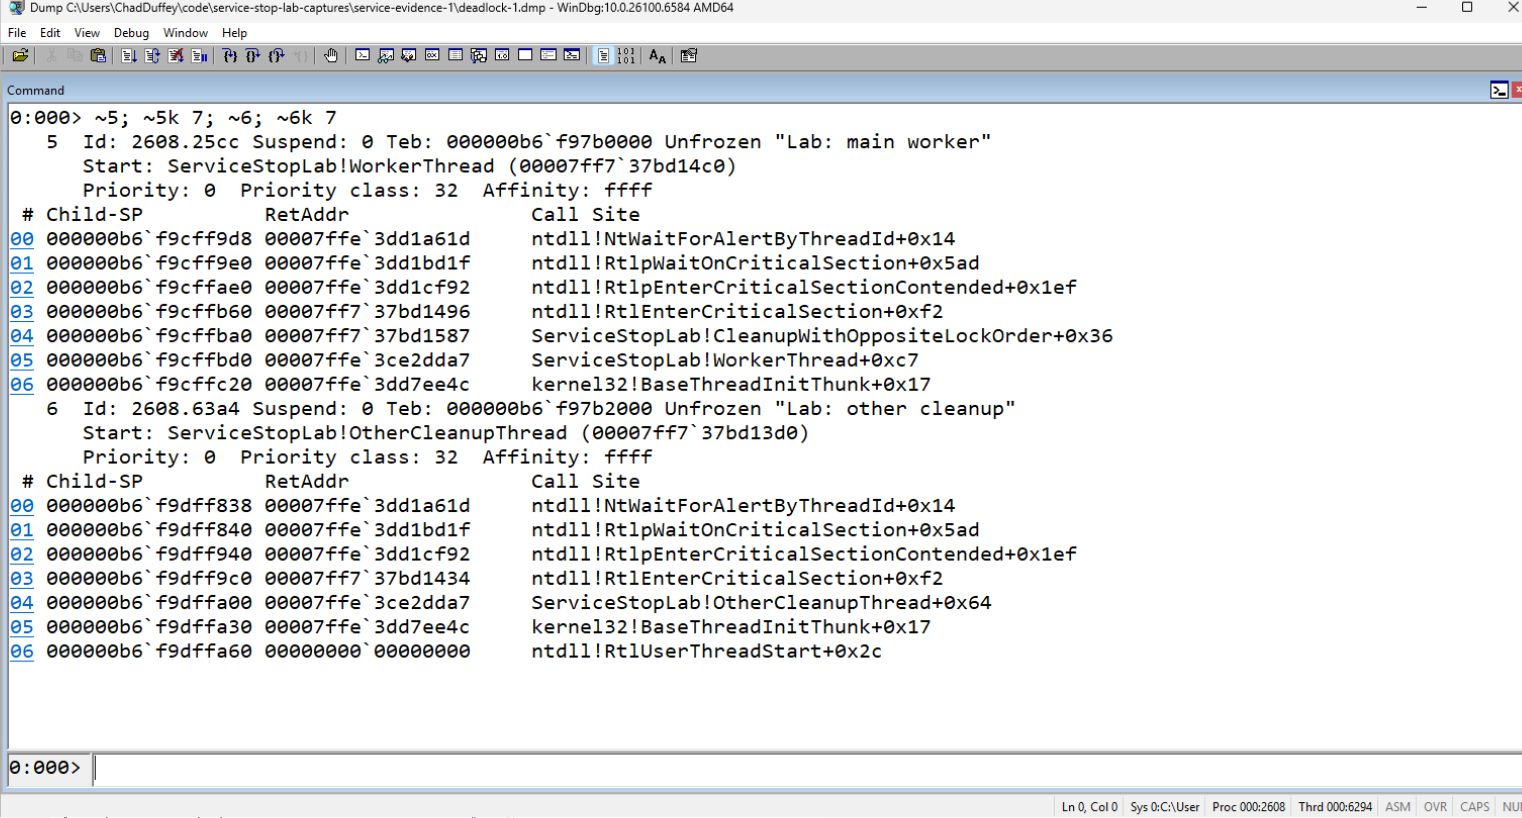
Both threads are waiting inside RtlEnterCriticalSection.
A critical section lets one thread at a time enter protected code. Normally the owner finishes, releases the lock, and the waiter continues. To find a deadlock, we need to trace the owners as well as the waits.
Join the waits to the lock owners
Use the user-mode critical-section extension:
!ntsdexts.locks
!ntsdexts.locks lists critical sections with debug records, which our sample retains. The explicit extension name distinguishes it from the kernel lock command.
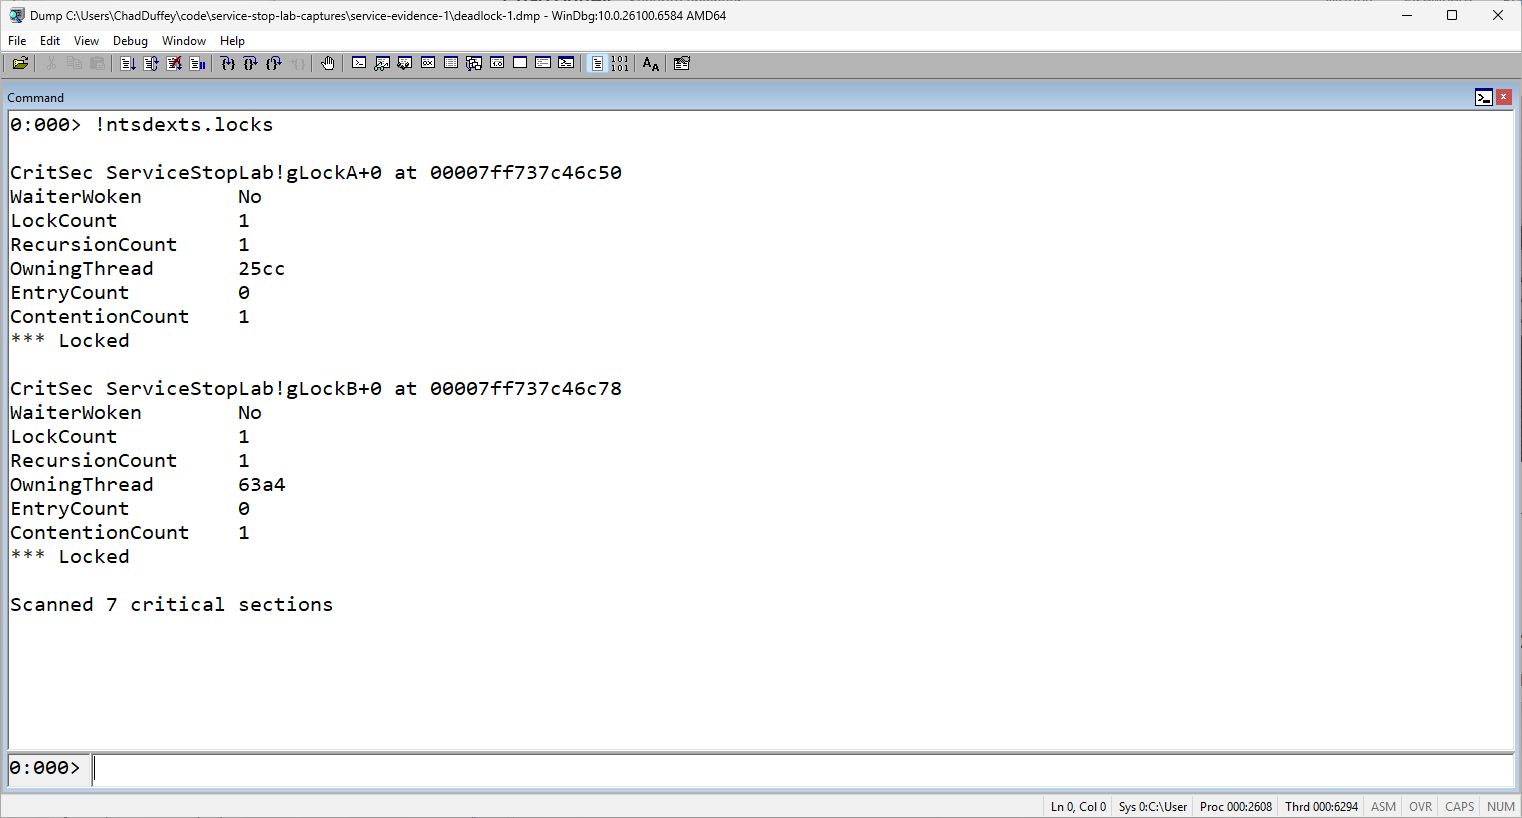
OwningThread identifies each critical section’s owner.
Match those owners to the OS thread IDs in the stack output, not debugger indexes 5 and 6. Then check which lock each thread wants. The source takes the same locks in opposite orders.
Two extra events make this repeatable: each thread waits until the other holds its first lock, then tries to acquire the second. I’ve left those coordination calls out below so the lock order is easier to see:
// Main worker: CleanupWithOppositeLockOrder
EnterCriticalSection(&gLockA);
// ... wait until the other thread holds B ...
EnterCriticalSection(&gLockB);

// OtherCleanupThread
EnterCriticalSection(&gLockB);
// ... wait until the main worker holds A ...
EnterCriticalSection(&gLockA);
You can inspect the compiled paths too:
uf ServiceStopLab!CleanupWithOppositeLockOrder
uf ServiceStopLab!OtherCleanupThread
On Windows x64, the first integer or pointer argument goes in RCX. Here is the main worker’s pending call, with instruction bytes omitted:
00007ff7`37bd1489  lea  rcx,[ServiceStopLab!gLockB (00007ff7`37c46c78)]
00007ff7`37bd1490  call qword ptr [ServiceStopLab!_imp_EnterCriticalSection (00007ff7`37c32050)]
lea puts the address of gLockB into RCX for EnterCriticalSection. The next instruction, 0x00007ff737bd1496, matches the return address on the worker’s RtlEnterCriticalSection stack frame. We’re waiting for B. The other thread’s pending call loads A instead. Use these caller instructions to recover the argument; the current RCX deep inside Windows may have changed.
Combined with the lock owners, we have:
| Thread in this capture | Holds | Waiting to acquire |
|---|---|---|
Main worker, 25cc |
A | B |
Other cleanup, 63a4 |
B | A |
Each thread needs the other to release its lock, and neither can reach its release. There’s our deadlock. ServiceMain is waiting for the main worker to exit, so shutdown can’t finish either.
Fix the order and run it again
The repaired mode makes both cleanup threads acquire A, then B:
void CleanupInOrder() {
    EnterCriticalSection(&gLockA);
    EnterCriticalSection(&gLockB);
    // Cleanup work goes here.
    LeaveCriticalSection(&gLockB);
    LeaveCriticalSection(&gLockA);
}
One thread can wait for A, but it won’t be holding B while it does. That removes the cycle we just followed in the debugger.
.\Reset-Lab.ps1
sc.exe start ServiceStopLab fixed-order
sc.exe queryex ServiceStopLab
Once it’s RUNNING, stop and query it:
sc.exe stop ServiceStopLab
sc.exe queryex ServiceStopLab
This mode reached STOPPED in our service test. All four modes are in the source.
Doing this on a real service
I apologise for making the lab this convenient. A real service may give you much less to work with. Ask yourself: what must happen for this thread to return, and who is supposed to make it happen?
Follow that dependency towards the worker, lock, or I/O request blocking shutdown. If you need to recover service first, fair enough. Capture what you can and note the service-to-PID mapping before terminating the process.
Why won’t /F kill it?
Our hangs prevent a normal stop, but they don’t prevent process termination. The more annoying case is when Task Manager won’t end the process either. These are different failures:
| What you see | Where the debugger helps |
|---|---|
The service stays in STOP_PENDING |
Follow the shutdown threads, as we did here. Terminating the process may already work. |
| Ending the process returns Access denied | Check elevation and process access. The debugger needs permission too; opening WinDbg doesn’t grant it. |
| Termination is requested, but the same PID remains | Pending I/O may be holding up exit. User-mode debugging can provide clues, but kernel evidence may be needed. |
WinDbg running elevated with SeDebugPrivilege can access many service processes. Protected services can still restrict access from ordinary admin processes.
In a live attached session, WinDbg’s .kill requests termination of the whole target process, including any other services hosted there. Follow it with g to process the exit events. Commands against a saved dump obviously won’t affect the live service if that’s an option for what you’re trying to achieve.
TerminateProcess requests termination and cancellation of pending I/O. The process cannot finish exiting until that I/O completes or is cancelled. A user-mode debugger won’t repair a driver that’s stuck handling it.
A kernel dump or remote kernel-debugging session may show what’s blocking exit. Kernel WinDbg’s .kill also schedules termination and isn’t supported during local kernel debugging. A reboot may still be needed, will probably be needed tbh (and safe). Check the PID before concluding a process survived: service recovery might have started a replacement and you’ll know because of the new PID.
Cleanup and test environment
Remove the installed lab from administrator PowerShell:
.\Reset-Lab.ps1 -RemoveService
This removes the service registration and the installed EXE/PDB. It leaves your source, dump files and symbol cache alone.
Captured on Windows 11 Business x64 26300.9711, with Windows PowerShell 5.1, ProcDump 12.02, and SDK x64 WinDbg 10.0.26100.6584. The lab uses Visual Studio 2022 Build Tools with optimisations disabled and private symbols. Addresses, thread IDs and some Windows frames will differ on your machine.
To repeat the checks and save your own dumps, use Test-Lab.ps1 as described in the README.